How to Set Up a Monitoring System for Windows Servers by Implementing Prometheus & Grafana
One day, my boss tasked me with a straightforward request: “Help me set up a monitoring system to track and monitor the system, assess its stability, and provide early warnings in case of any issues.” Upon receiving this request, I immediately thought of several tools currently available, such as Kibana and Nagios. However, during the solution-building process, a colleague suggested Grafana. After researching, I found Grafana to be a suitable fit for my requirements and began exploring solutions to apply it.
In this article, we will focus on the following issues:
- What is a monitoring system?
- Why do we need a monitoring system?
- Characteristics of a monitoring system
- Grafana & Prometheus
- Creating a simple dashboard from Grafana and Prometheus
What is a monitoring system?
A monitoring system is a software or hardware component capable of continuously tracking and recording the states and operations of a system.
Why do we need a monitoring system?
In the past, administrators/developers would only intervene when a system encountered errors. This led to numerous risks in troubleshooting or involved using only a few small tools that could not provide a comprehensive view, resulting in a waste of time and money.
A monitoring system is a suitable solution, helping administrators/developers easily track and assess the system comprehensively (analyzing CPU, RAM, disk, etc.), thereby building a stable system and quickly responding to any occurring incidents. Additionally, the centralized management feature of monitoring systems ensures that you will receive immediate notifications in case of any issues, helping you resolve them quickly, saving time, and providing peace of mind for the system.
Prometheus & Grafana Overview
Prometheus and Grafana are two widely used software tools in monitoring systems, addressing essential needs such as data collection, stability assessment, and early warning when one or more system targets encounter issues.
Prometheus
Originally developed at SoundCloud, Prometheus is an open-source system monitoring and alerting tool. In 2012, many companies and organizations supported Prometheus, leading to significant project growth and a large user base. Today, it’s no longer an independent project but is developed by numerous companies and utilizes Google’s GoLang source code. Prometheus is fully open-source and licensed under the Apache 2 License on GitHub.
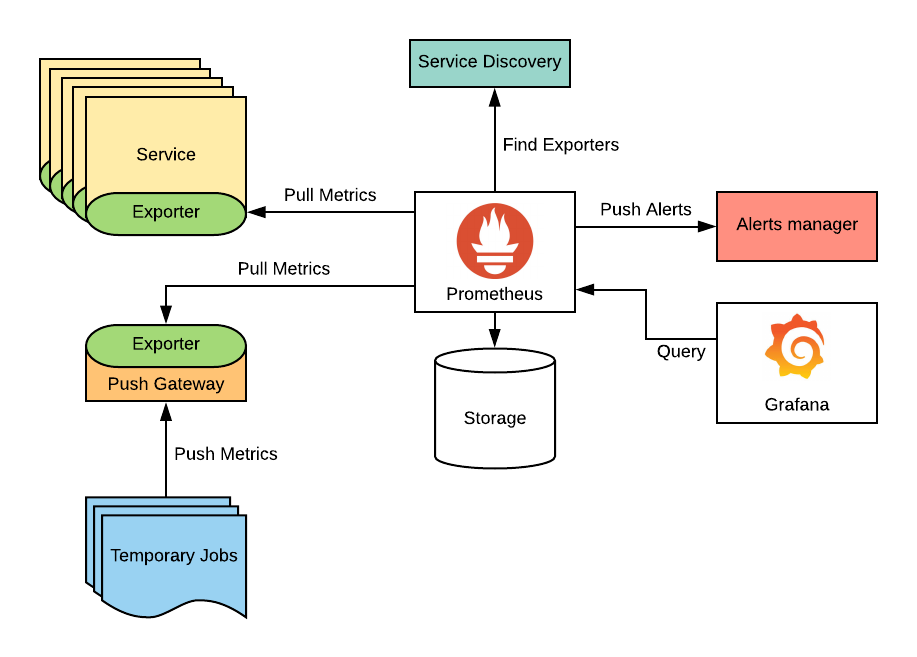
Prometheus employs a powerful query language to pull metrics from nodes and then transfers data to Grafana for web-based visualization.
Prometheus includes a built-in exporter that outputs metrics about the Prometheus service to the URL: http://localhost:9090/metrics. However, to obtain other metrics, Prometheus relies on third-party exporters or those developed by individual contributors.
Reactive problem-solving using small tools can lead to significant risks and a lack of comprehensive system oversight, resulting in time and cost inefficiencies.
Grafana
Grafana is a Container Monitoring Software solution offering a feature set and cost that is well-suited for both small and medium-sized enterprises (SMEs) as well as larger corporations. Grafana is highly regarded by both users and experts in the DevOps Software field.
Grafana focuses on time-series data. You can visualize data or create alerts from existing data sources. In addition to Prometheus, Grafana can also utilize various other databases including Elasticsearch, InfluxDB, OpenTSDB, Graphite, and more.
Grafana is known for its built-in support for authentication and access control. You can also connect your Grafana instance to an external Lightweight Directory Access Protocol (LDAP) server or SQL server for better access control in enterprise settings.
Key features of Grafana:
- Visualize: Create various visualizations such as tables, charts, and gauges.
- Alert: Set up alerts and notifications through email, Microsoft Teams, Slack, Telegram, and more.
- Unify: Integrate with multiple data sources like Prometheus, InfluxDB, ElasticSearch, and Graphite.
- Open: Open-source, compatible with various operating systems, and available as a Docker image.
- Extend: Offers a wide range of plugins, dashboard templates, and easy integration with other platforms.
- Collaborate: Facilitates teamwork and collaboration.
Creating a simple Dashboard with Grafana and Prometheus
In this section, we will create a basic dashboard to monitor a Windows server using Grafana and Prometheus.
Set up Prometheus
You can use Prometheus via Docker or a pre-compiled binary file.
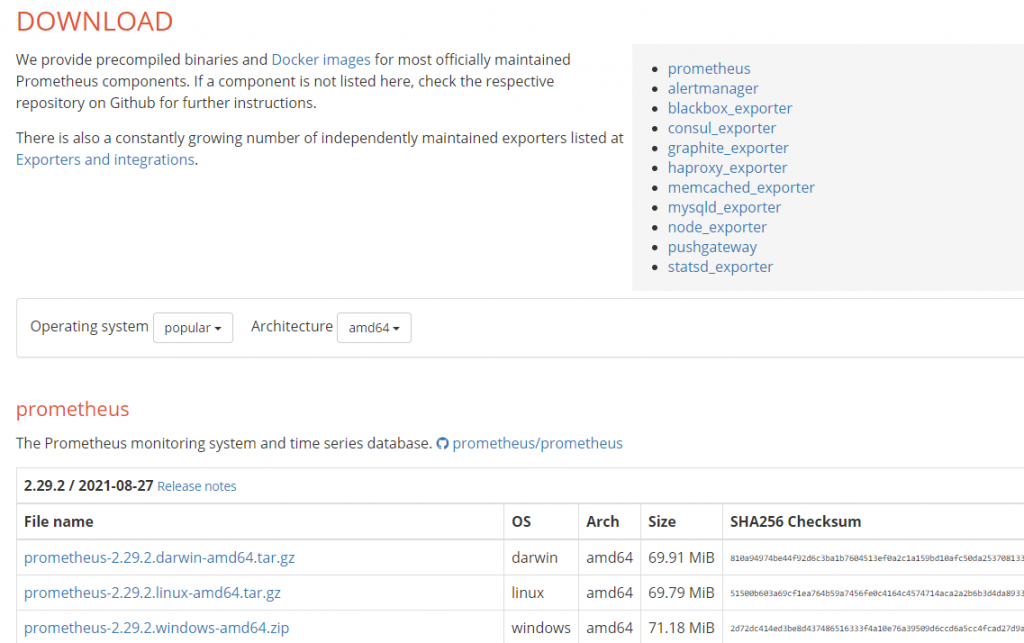
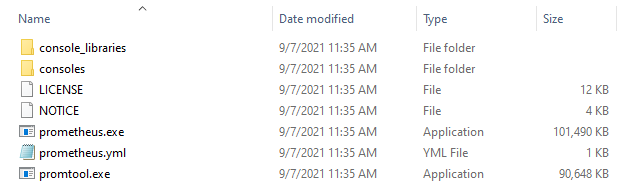
We will use the pre-compiled binary file for Windows. After downloading and extracting, it will look like this:
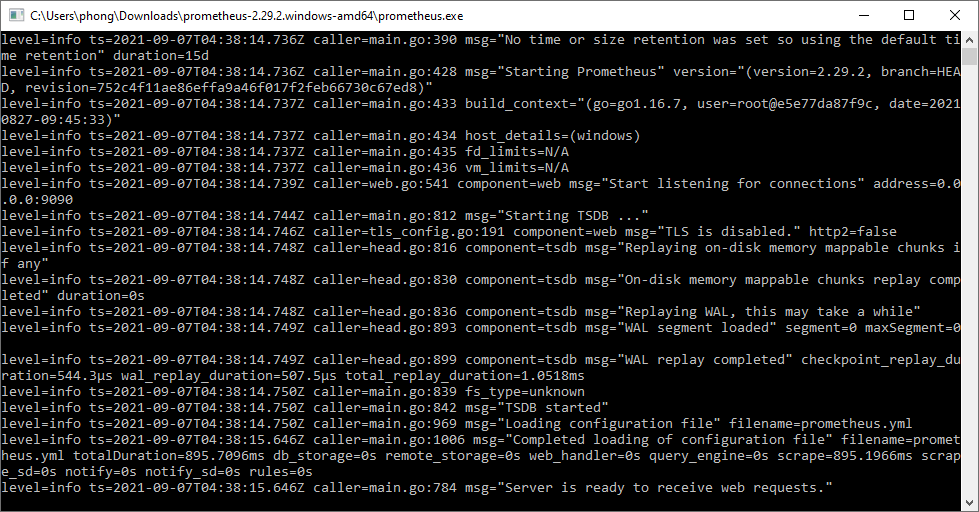
Để sử dụng Prometheus, chúng ta mở file prometheus.exe ở thử mục gốc và truy cập đường dẫn http://localhost:9090/
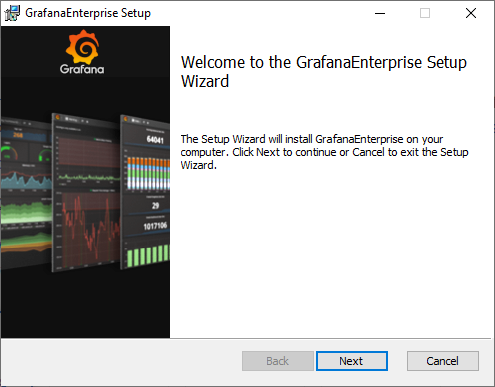
Installing Grafana
Similar to Prometheus, there are multiple ways to install Grafana.
In this case, we will install it through Windows: https://grafana.com/grafana/download
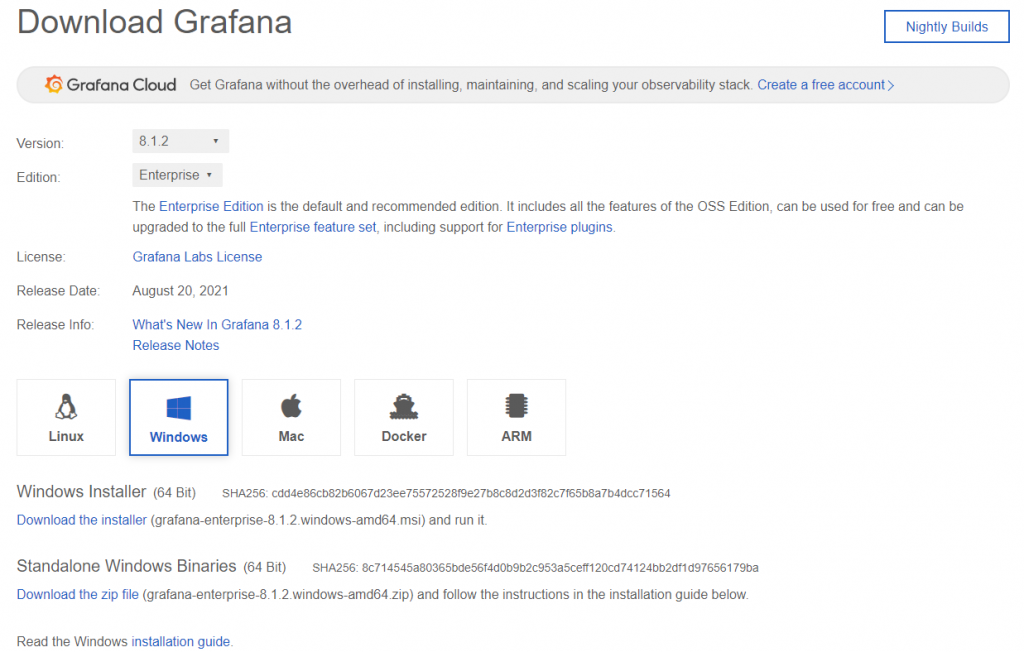
After downloading the installation file, please follow the instructions to install it.
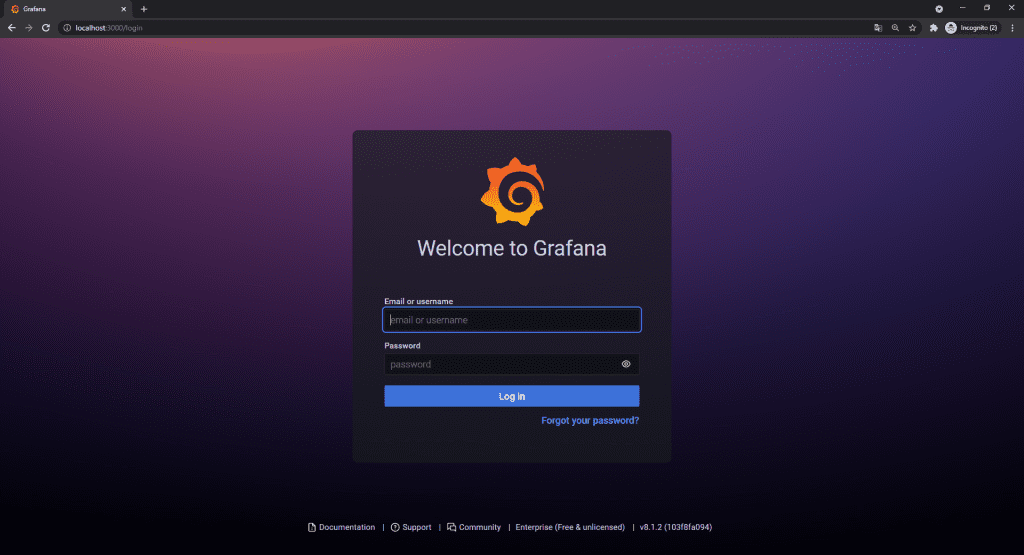
After installation, you can access the application at: http://localhost:3000/
Connecting Grafana to Prometheus
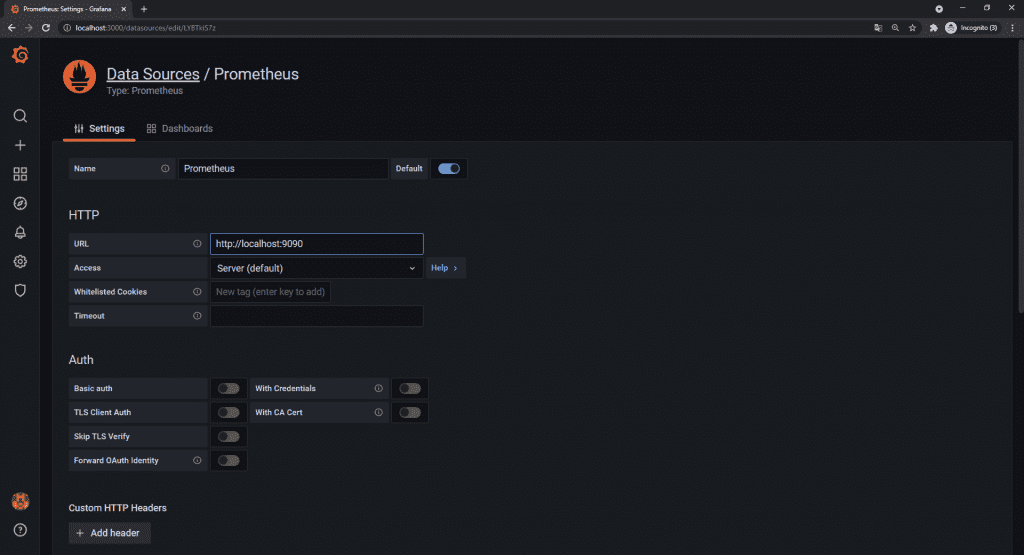
Grafana supports multiple data sources, so to integrate data from Prometheus, you’ll need to add a new data source. To do this, navigate to: http://localhost:3000/datasources/new (Configuration -> Data Source -> Add data source).
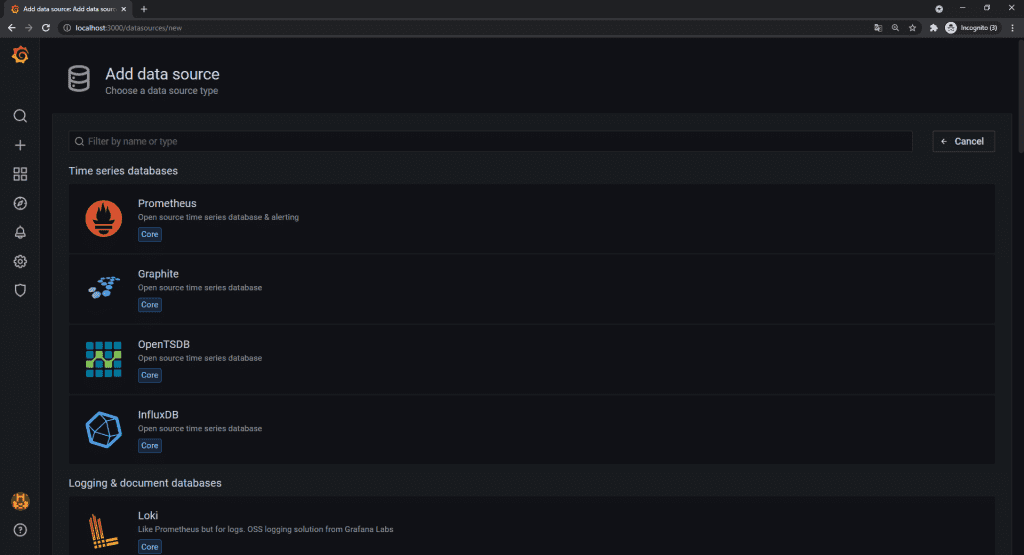
Then select Prometheus, fill in the configuration information (URL), and save.
Monitoring Windows Server
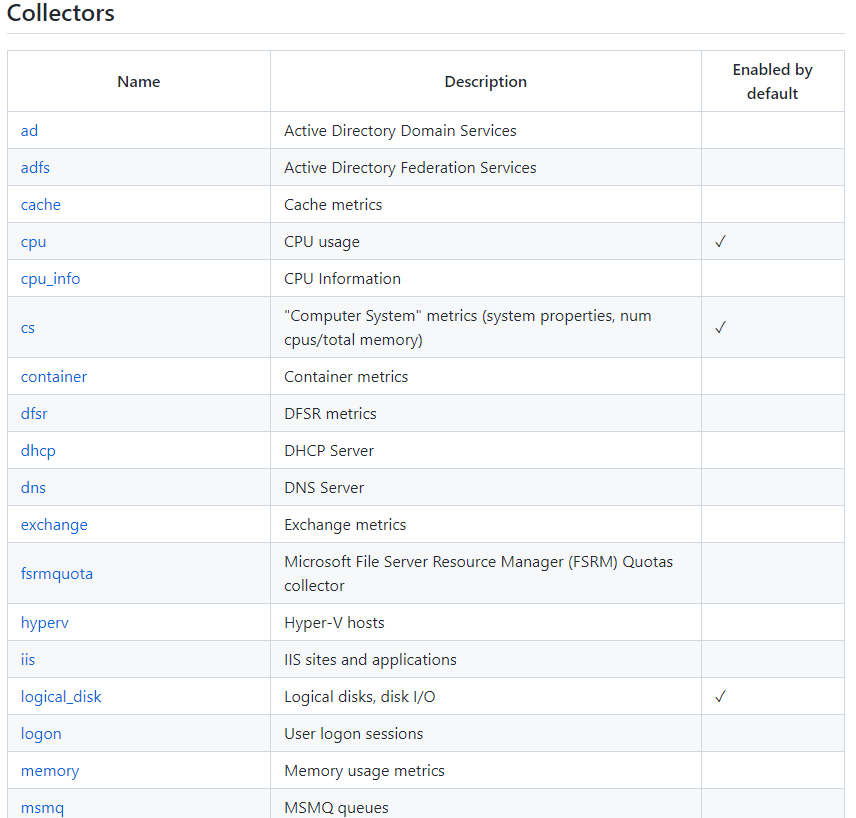
To monitor Windows Server, we need to utilize a third-party tool: windows_exporter (wmi_exporter) to enable Prometheus to collect metrics. For more details, please refer to:
https://github.com/prometheus-community/windows_exporter
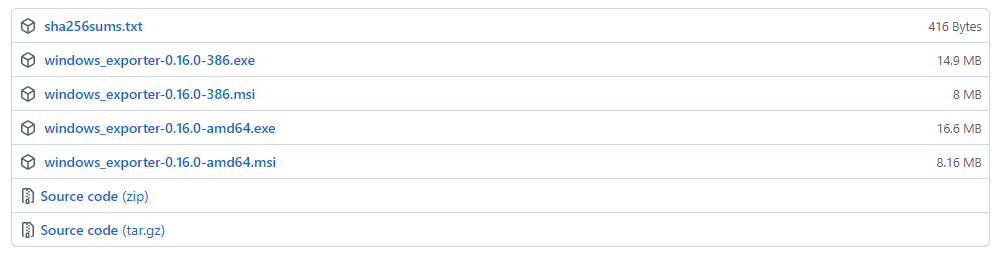
Step 1: Download the latest version of wmi_exporter from:
https://github.com/prometheus-community/windows_exporter/releases
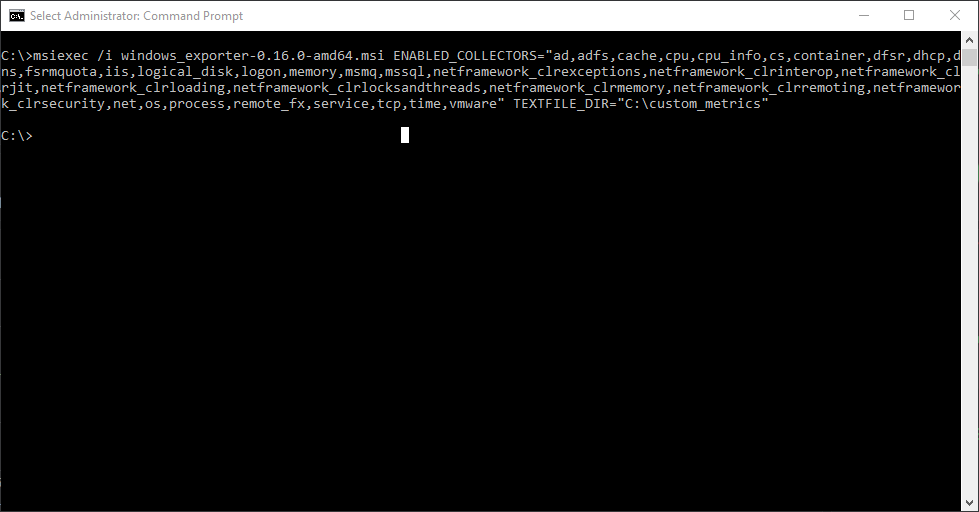
There are 2 versions of wmi_exporter:
- wmi_exporter.exe: Used to run and utilize default configurations.
- wmi_exporter.msi: Installs via cmd/psh and uses advanced configurations.
We will install via CMD. After downloading, open CMD and run the following command:
msiexec /i windows_exporter-0.16.0-amd64.msi ENABLED_COLLECTORS="ad,adfs,cache,cpu,cpu_info,cs,container,dfsr,dhcp,dns,fsrmquota,iis,logical_disk,logon,memory,msmq,mssql,netframework_clrexceptions,netframework_clrinterop,netframework_clrjit,netframework_clrloading,netframework_clrlocksandthreads,netframework_clrmemory,netframework_clrremoting,netframework_clrsecurity,net,os,process,remote_fx,service,tcp,time,vmware" TEXTFILE_DIR="C:\custom_metrics"
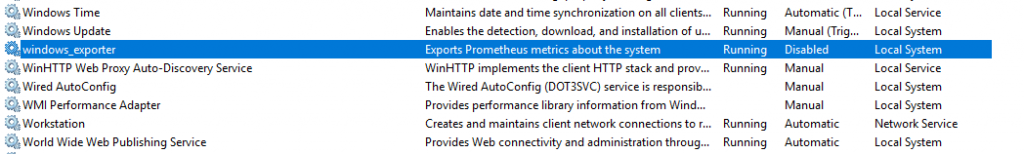
After installation, there will be a service called ‘windows_exporter’ running in the Services.
Step 2: Check Metric
Access the link http://localhost:9182
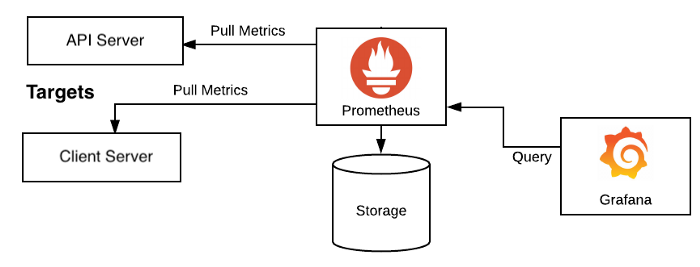
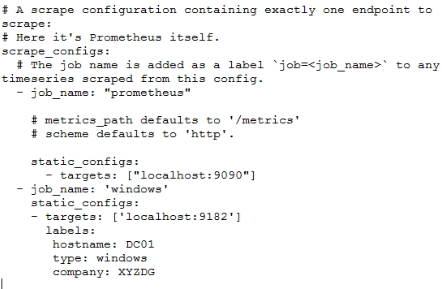
Step 3: Create a job in Prometheus to monitor Windows Server
Edit the prometheus.yml file, and add the following content:
- job_name: 'windows'
static_configs:
- targets: ['localhost:9182']
labels:
hostname: DC01
type: windows
company: XYZDG
Here’s the result:
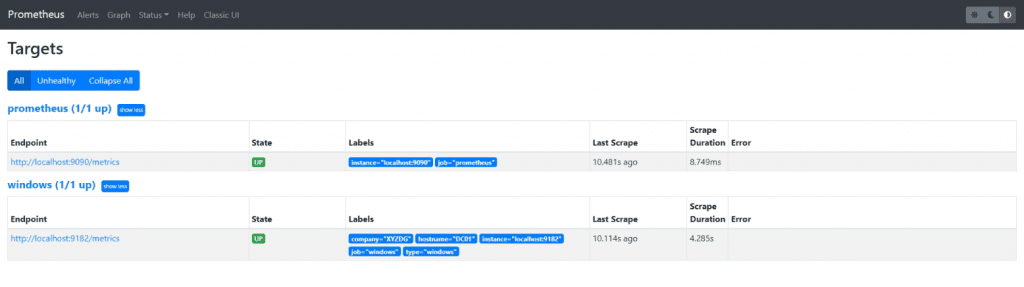
Step 4: Restart Prometheus Application
After restarting Prometheus, we access the URL http://localhost:9090/targets (Status/Targets) again. We will see 2 jobs running:
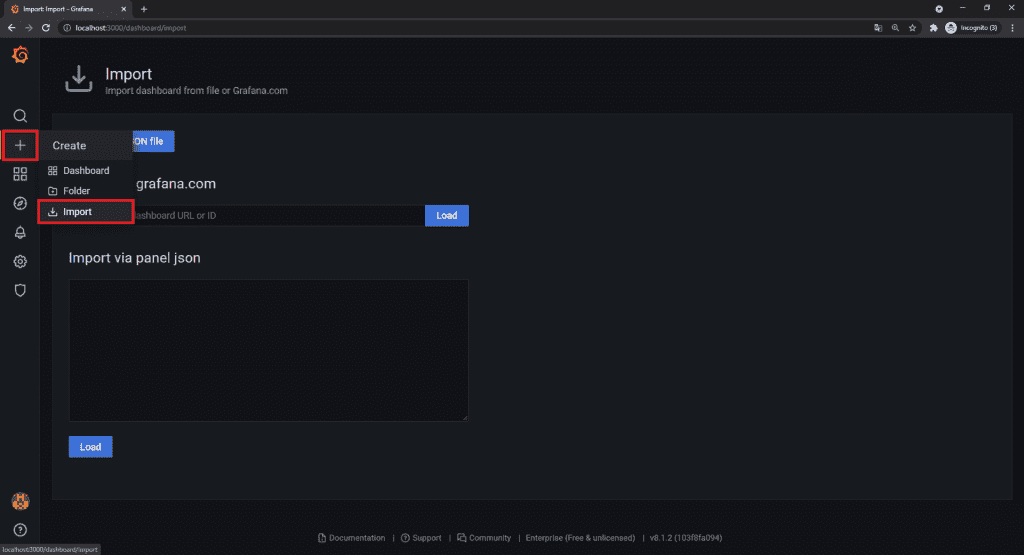
Step 5: Create a Windows Server Monitoring Dashboard on Grafana
This step describes how to use the import function to import a pre-built dashboard. You can find various dashboards on the Grafana website at the following link:
https://grafana.com/grafana/dashboards?dataSource=prometheus&search=windows_exporter
Now we use Windows Exporter Dashboard.
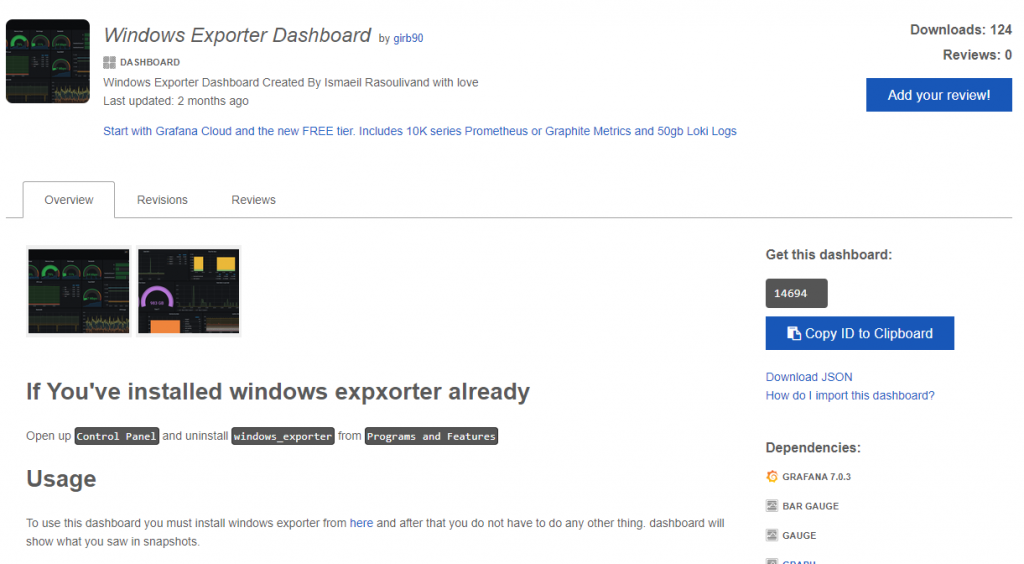
Load the corresponding dashboard and select the appropriate data source.
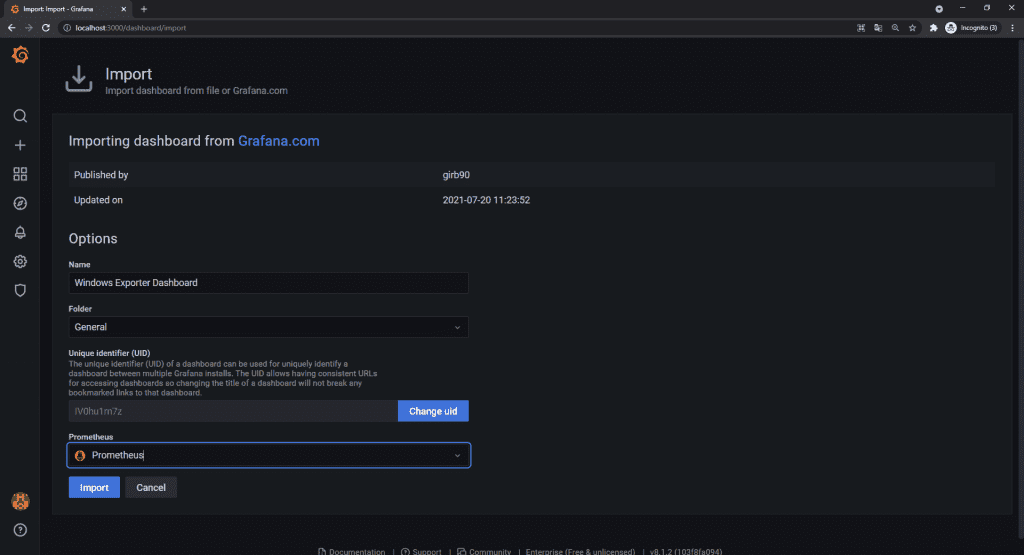
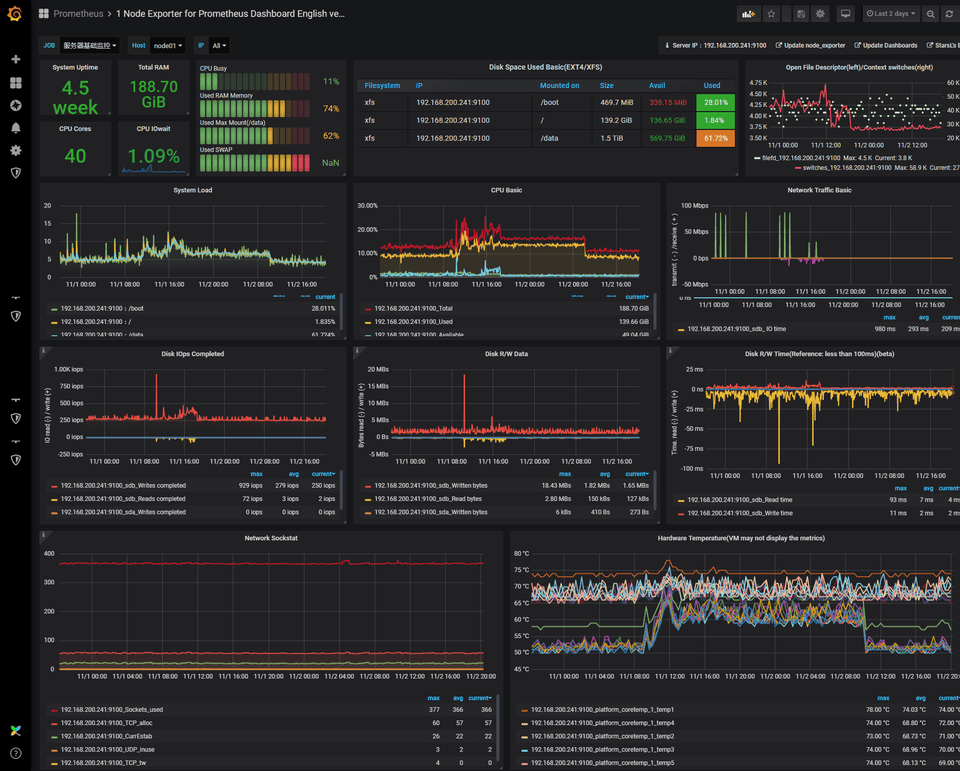
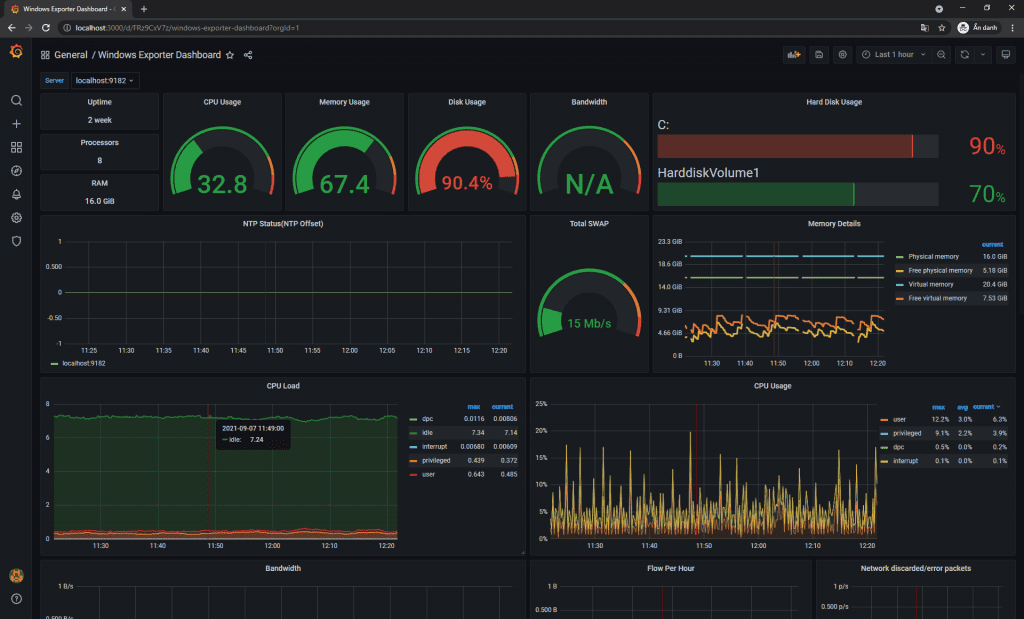
After successful import, we will have the following results:
Summary
In this article, we’ve provided an overview of essential knowledge about Monitoring systems, introduced Grafana in combination with Prometheus, and guided you through setting up monitoring for Windows servers.
In upcoming articles, we’ll delve into configuring alerts through Microsoft Teams, Telegram, or integrating data from various sources, as well as discussing the implementation of this system within a DevOps workflow.
Please note that this content is based on our research and implementation experience, and there may be some inaccuracies. We welcome your feedback and comments.
Thank you for taking the time to read our article.
Author: Phong Pham, Senior Software Developer at New Ocean IS